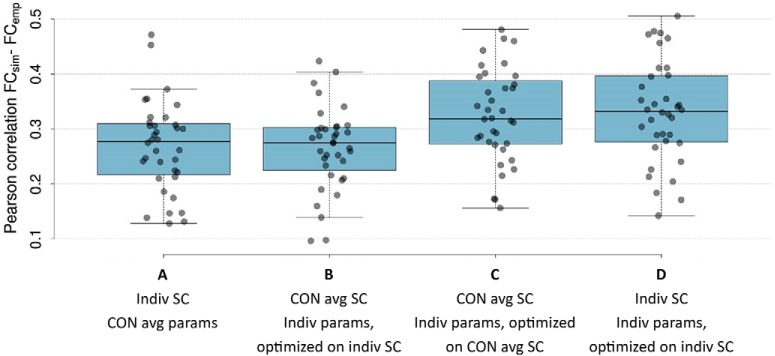
Figure 2.
Pearson correlation coefficient between simulated and empirical FC for all 36 subjects. Simulated FC was obtained using (A) average model parameters of control group with individual SC matrices; (B) control average SC matrix with individually optimized model parameters obtained from parameter space explorations on the individual SC matrices; (C) control average SC matrix with individually optimized model parameters obtained from parameter space explorations on the control average SC matrix; and (D) individually optimized model parameters and individual SC matrices.

