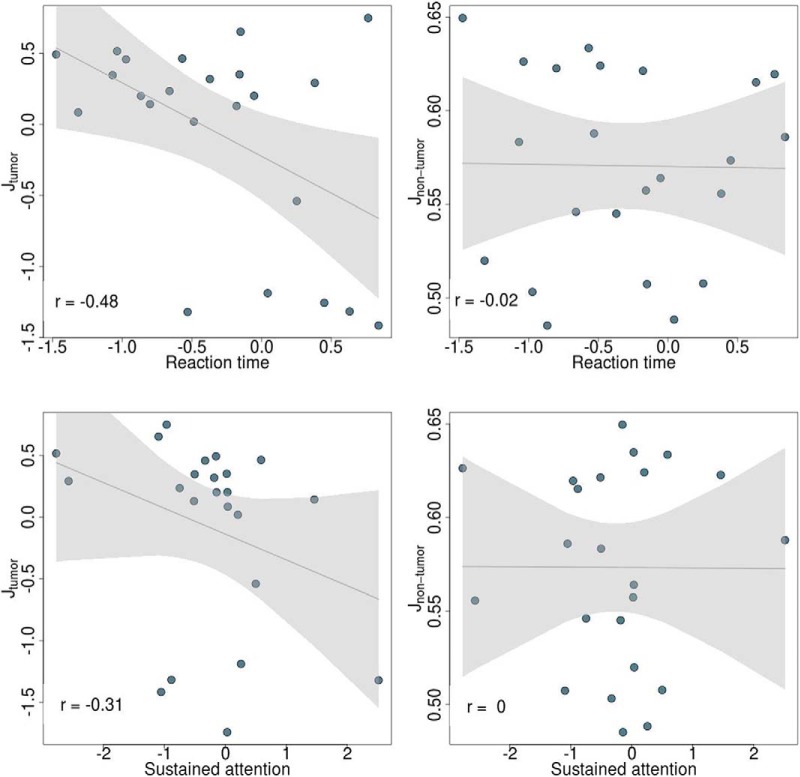
Figure 6.
Linear relationship between reaction time (top) and sustained attention (bottom) and feedback inhibition control parameter (corrected for region size) across tumor (left) and non-tumor (right) regions in meningioma and glioma patients. Gray line represents regression line with 95% confidence interval.

