Figure 3.

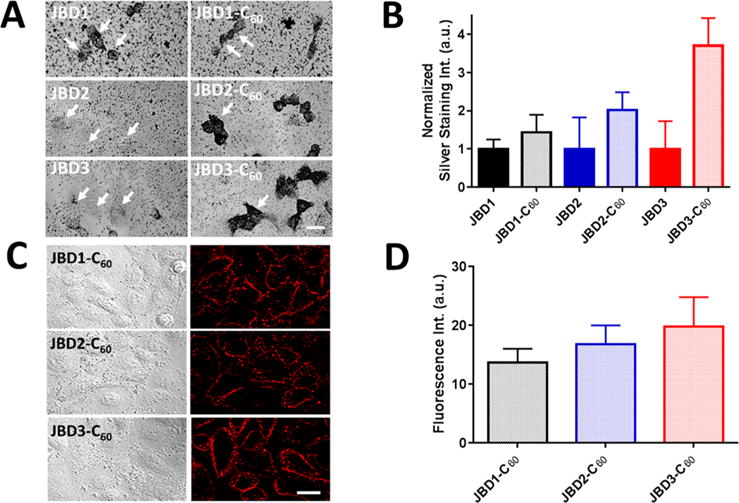
Membrane binding of JBD peptides, JBD–C60 peptide conjugates, and QD–DHLA–peptide–C60 conjugates. Immunocytochemistry combined with silver staining was used to visualize gold nanoparticle-bearing immunoplexes in A549 cells. (A) Cells were incubated with 10 μM JBD peptide minus C60 (left column) or 10 μM JBD peptide–C60 conjugate (right column), fixed/permeabilized, immunoprobed, and silver stained for the presence of the C60 moiety. White arrows point to individual cells. Scale bar, 20 μm. (B) Comparative quantitative analysis of silver stain intensity of the images shown in A. Silver stain intensity was quantified by treating individual cells in each image as separate regions of interest (ROIs). The bar graph shows the resulting average ± SEM of silver stain intensities corresponding to at least 40 cells for each sample (three independent experiments). (C) DIC (left) and confocal fluorescence (right) images of A549 cell monolayers labeled with 605 nm QD–DHLA–JBD peptide–C60 complexes as indicated. The micrographs show robust binding of the QD–peptide–C60 conjugates to the plasma membrane. Scale bar, 20 μm. (D) Quantification of membrane staining of the QD–peptide–C60 QD complexes in panel C. Fluorescence intensities were determined by drawing an ROI around the plasma membrane of individual cells. Bar graph shows the average ± SEM fluorescence intensities of 50 to 70 cells for each sample from four independent experiments. The results shown are background corrected for nonspecific binding of QD alone (no peptide).
