
Figure 4.
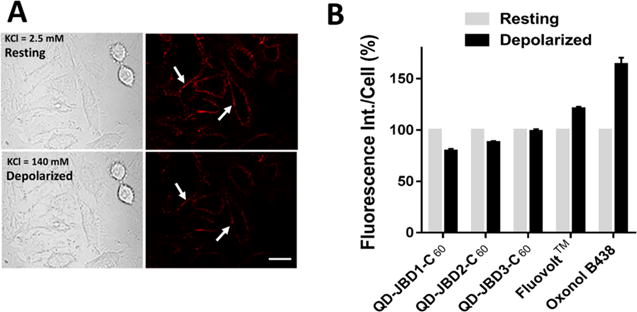
Imaging of membrane potential changes in cells labeled with QD–DHLA–JBD peptide–C60 bioconjugates. (A) Differential interference contrast (DIC) and confocal fluorescence images of HeLa cell monolayers labeled with 605 nm QD–DHLA–JBD1 peptide–C60 bioconjugates before (top) and after (bottom) depolarization with KCl solution. Labeled cell monolayers were cultured in live cell imaging solution (LCIS) containing 2.5 mM KCl (resting, top). Depolarization of membrane potential was performed by addition of LCIS containing 140 mM KCl (depolarized, bottom). Scale bar, 20 μm. Arrows highlight the same cell in each panel. (B) Quantification of the fluorescence intensity decrease from resting (2.5 mM KCl, gray bar) to depolarized (140 mM KCl, black bar) membrane potential for the QD–peptide–C60 conjugates. The fluorescence response increase of the commercial VSDs FluoVolt and oxonol B438 are shown for comparison.