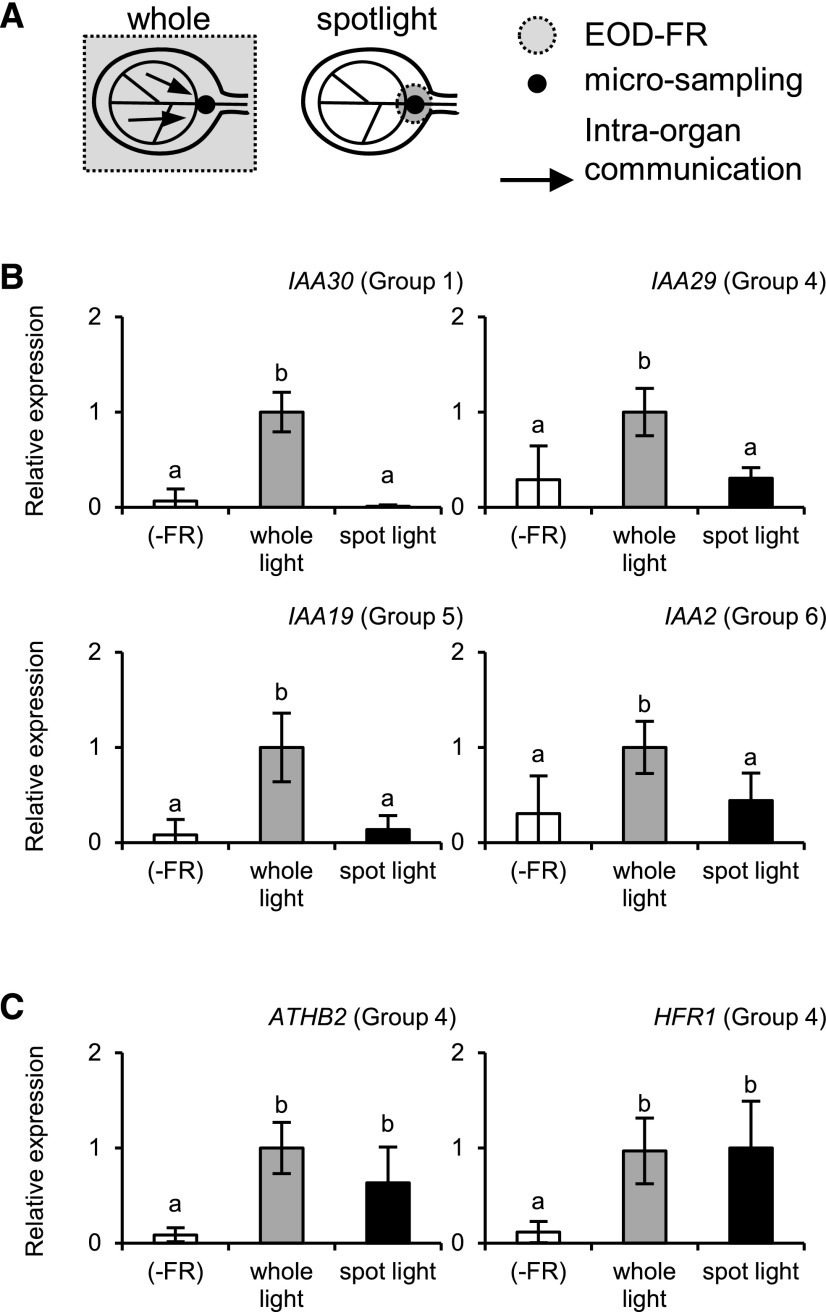
Figure 5.
Gene expression responses to spotlight EOD-FR irradiation in the wild type (accession Landsberg erecta). A, Diagram explaining the spotlight and whole-seedling irradiation of a cotyledon. The VN micro sample was excised from the irradiated area for RT-qPCR analysis. B and C, Gene expression responses to the whole-seedling (gray bar) or spotlight (black bar) EOD-FR irradiation in VN. Seedlings not treated with EOD-FR were used as controls (white bar). The seedlings were light-treated as described for Figure 1, except that two micro sample pieces were combined in a tube for cDNA synthesis. TUB2/TUB3 was used to standardize the results. The expression levels are shown in arbitrary units setting the highest value to 1 (n ≥ 4, mean ± sd). Different letters denote significant differences between the samples (P < 0.05, Student’s t test).

