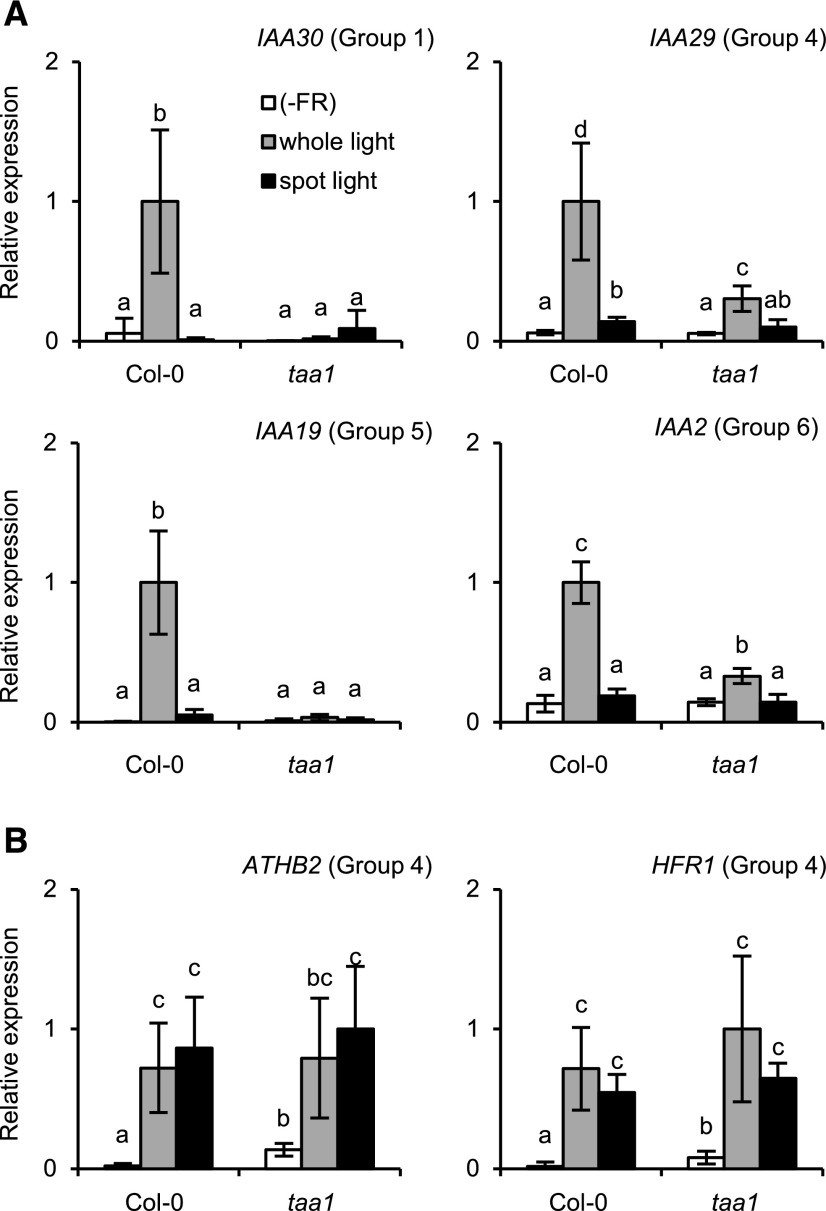
Figure 6.
Gene expression responses to EOD-FR in the taa1 mutant and respective wild type (accession Col-0). The cDNA samples were prepared and analyzed as described for Figure 5, except that four micro sample pieces were combined in a tube for cDNA synthesis. The bar colors are as described for Figure 5. TUB2/TUB3 was used to standardize the results. The expression levels are shown in arbitrary units setting the highest value to 1 (n ≥ 3, mean ± sd). Different letters denote significant differences between the samples (P < 0.05, Student’s t test). A, Auxin-responsive genes; B, AtHB2 and HFR1.

