Figure 3.
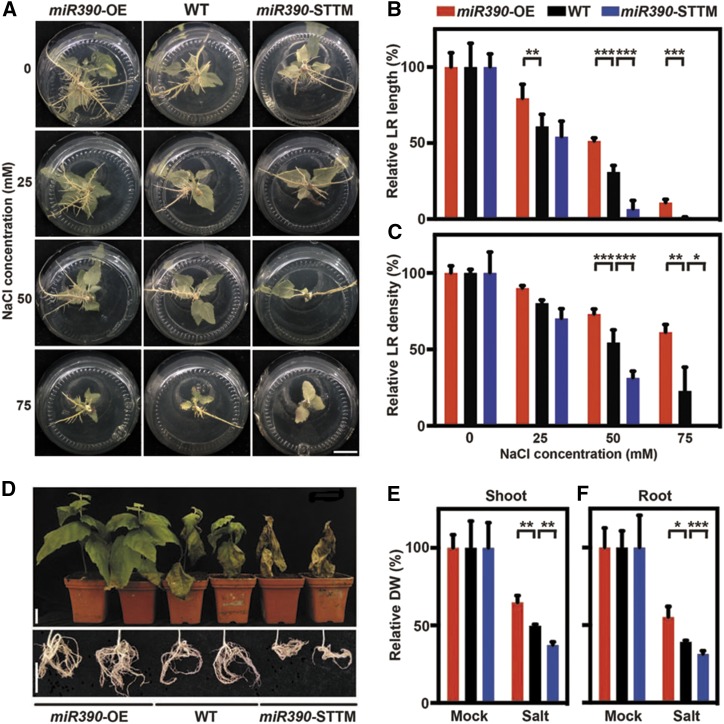
miR390 enhances the salt tolerance of LR growth and biomass accumulation in poplar. A, LR phenotypes of seedlings of wild-type (WT), miR390-OE, and miR390-STTM lines under salt treatment. Cutting-propagated seedlings were cultivated in vitro and subjected to 0, 25, 50, and 75 mm NaCl for 4 weeks. Bar = 2 cm. B and C, Relative quantification of total LR length (B) and LR density (C) in seedlings of wild-type, miR390-OE, and miR390-STTM lines under salt treatment. Cutting-propagated seedlings were cultivated in vitro and subjected to 0, 25, 50, and 75 mm NaCl for 4 weeks. The values for each genotype without NaCl treatment were normalized to 100%. Nonnormalized values are given in Supplemental Figure S3, F and G. D, Shoot and root phenotypes of 10-week-old wild-type, miR390-OE, and miR390-STTM plants under salt treatment. Poplar plants were cultivated in soil for 4 weeks and watered subsequently with 200 mm NaCl for 6 weeks. Bars = 5 cm. E and F, Relative quantification of shoot (E) and root (F) biomass (dry weight [DW]) of wild-type, miR390-OE, and miR390-STTM plants under salt treatment. Poplar plants were cultivated and salinity treated as described in D. The values for each genotype under mock treatment were normalized to 100%. Nonnormalized values are given in Supplemental Figure S3, H and I. For B, C, E, and F, error bars represent sd, and asterisks indicate statistically significant differences in two-way ANOVA followed by Dunnett’s test for pairwise comparisons between wild-type and transgenic lines (*, P < 0.05; **, P < 0.01; and ***, P < 0.001; n = 5).

