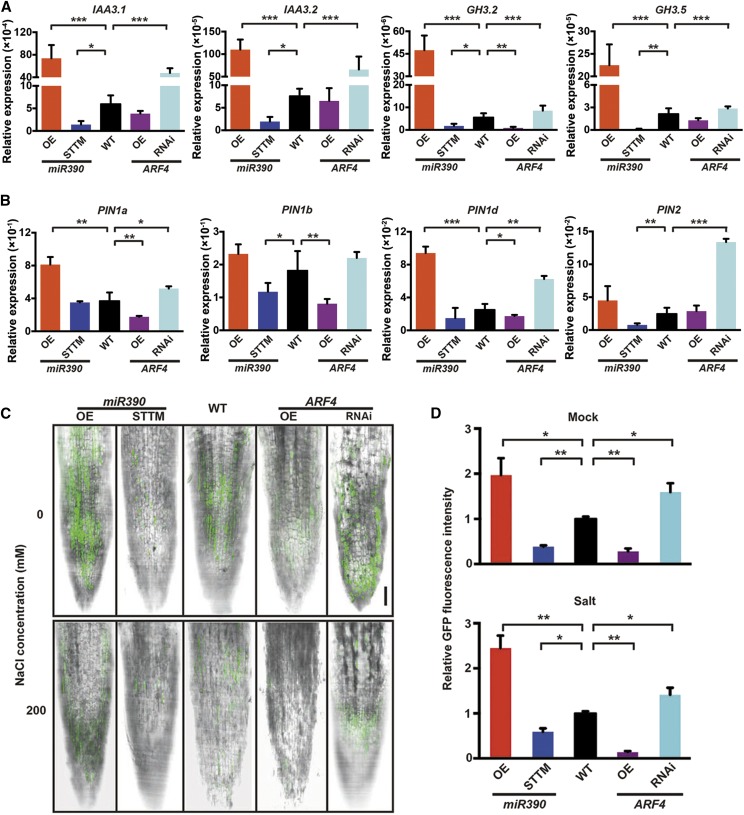
Figure 6.
Auxin accumulation is altered by miR390 and ARF4 in LR tips. A, Expression levels of typical auxin-responsive genes, including IAA3.1/3.2 and GH3.2/3.5, in LRs of miR390/ARF4 transgenic lines. LRs of 4-week-old seedlings of wild-type (WT), miR390-OE/STTM, and ARF4m-OE/ARF4-RNAi lines cultivated in vitro were collected for RT-qPCR assay. 18S rRNA was used as a reference for normalization. Error bars represent sd. Asterisks indicate statistically significant differences in one-way ANOVA followed by Dunnett’s test for pairwise comparisons between wild-type and transgenic lines (*, P < 0.05; **, P < 0.01; and ***, P < 0.001; n = 3). B, Expression quantification of select PIN genes, including PIN1a, PIN1b, PIN1d, and PIN2, in root tissues of miR390/ARF4 transgenic plants. RT-qPCR assay and statistical analysis were performed as described in A. C, Detection of GFP fluorescence driven by the auxin-responsive DR5 promoter in LR tips of the miR390/ARF4 transgenic lines under salt treatment. Four-week-old seedlings of wild-type, miR390-OE/STTM, and ARF4m-OE/ARF4-RNAi lines harboring the DR5 promoter were subjected to 0 mm (mock) or 200 mm NaCl (salt) for 24 h. LR tips were detected for GFP fluorescence via confocal microscopy. Bar = 10 μm. D, Quantitative measurement of GFP fluorescent signals driven by the auxin-responsive DR5 promoter in LR tips of the miR390/ARF4 transgenic lines under salt treatment. Salt treatment and fluorescence detection were conducted as described in C. Fluorescence was quantified via the software FV10 ASW (Olympus). Error bars represent sd. Asterisks indicate statistically significant differences in one-way ANOVA followed by Dunnett’s test for pairwise comparisons between wild-type and transgenic lines (*, P < 0.05 and **, P < 0.01; n = 5).

