Figure 2.
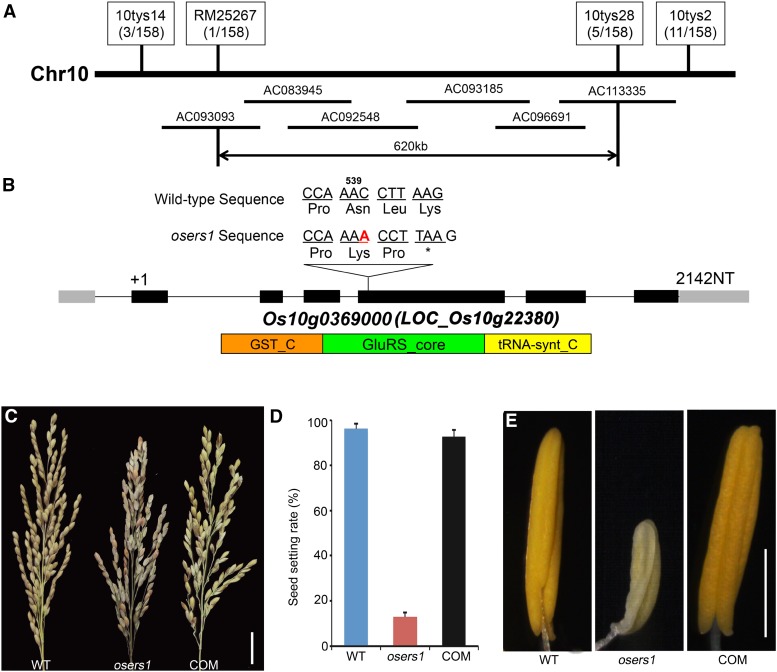
Molecular identification of OsERS1. A, Fine-mapping of OsERS1 to chromosome 10. The molecular markers used for mapping are indicated. Numbers in parentheses indicate the number of recombinants. AC numbers are rice genomic DNA accession numbers of bacterial artificial chromosome clones. B, Schematic representation of OsERS1 and functional domains. The red A indicates an insertion after A539 in oser1. NT, Nucleotides. Black rectangles represent exons. The asterisk means a stop codon. GST_C, Glutathione S-transferase C-terminal domain; GluRS_core, catalytic core domain of glutamyl-tRNA synthetase; tRNA-synt_C, tRNA synthetases class I anticodon binding domain. C to E, Complementation of the osers1 mutant. C, Inflorescences with mature seeds. D, Average seed-setting rates in panicles (n = 20 for each set). Error bars represent sd. E, Mature anthers. COM, Complementation; WT, wild type. Bars = 2 cm in C and 1 mm in E.

