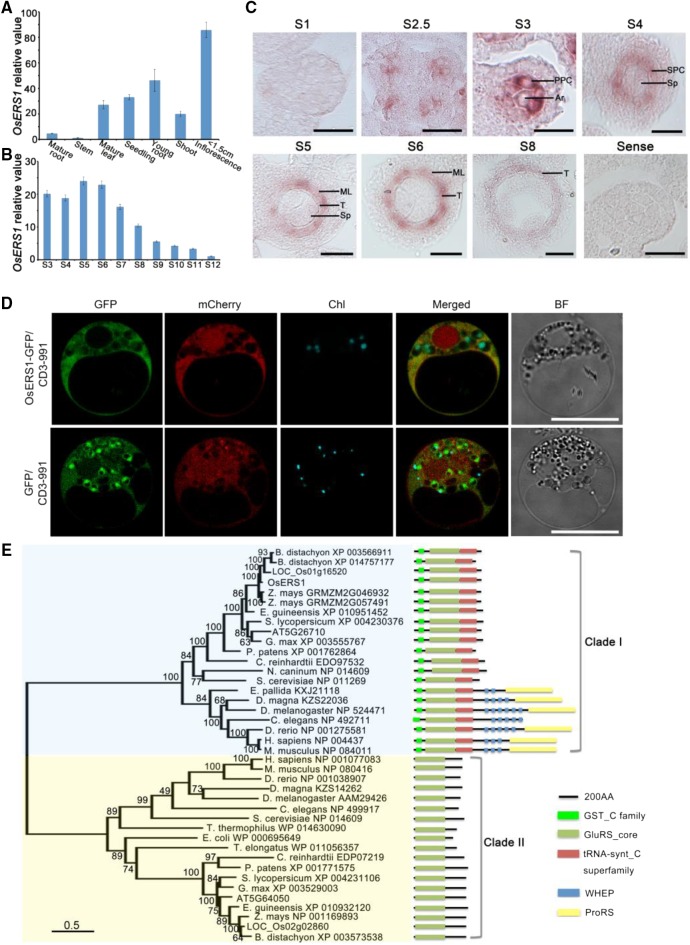
Figure 3.
Expression pattern and phylogenetic analysis of OsERS1. A and B, RT-qPCR data showing relative expression levels of OsERS1 in various tissues (A) and anthers at various stages (B). For B, total RNA was extracted from whole rice flowers before stage 6 and from anthers after stage 7. All error bars represent sd (n = 3). C, In situ hybridization of OsERS1 in the wild-type anther at different stages. A sense probe was used as the control. Ar, Archesporial cell; ML, middle layer; Sp, sporogenous cell; T, tapetum. Bars = 15 μm. D, Subcellular localization of OsERS1 in rice protoplasts. GFP was used as a control. Vector CD3-991 containing the mitochondria-specific protein ScCOX4 fused with mCherry served as the organelle marker. Chl, Chloroplast; BF, bright field. Bars = 10 μm. E, Neighbor-joining tree of OsERS1 and its homologs showing the progressive recruitment of novel functional domains. AA, Amino acids; GST_C, C terminus of GST; GluRS_core, glutamyl-tRNA synthetase catalytic core; tRNA-synt_C, tRNA synthetase class I anticodon binding domain; ProRS, prolyl-tRNA synthetase.

