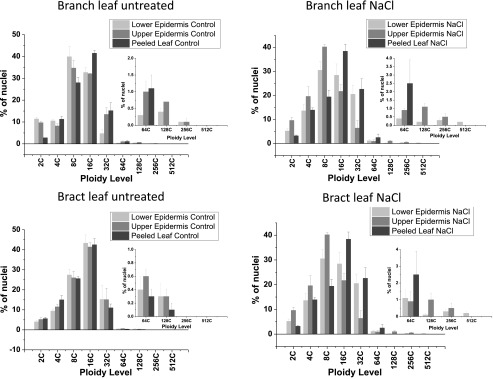
Figure 4.
Bar graphs showing average normalized nuclear counts for each ploidy level in the branch or bract leaves from adult plants. Samples were as follows: peeled leaf (dark gray bars), upper epidermal peels (medium gray bars), and lower epidermal peels (light gray bars). Insets show expansion of the y axis to visualize high-ploidy nuclear counts. Data are means ± se of three independent biological replicates.

