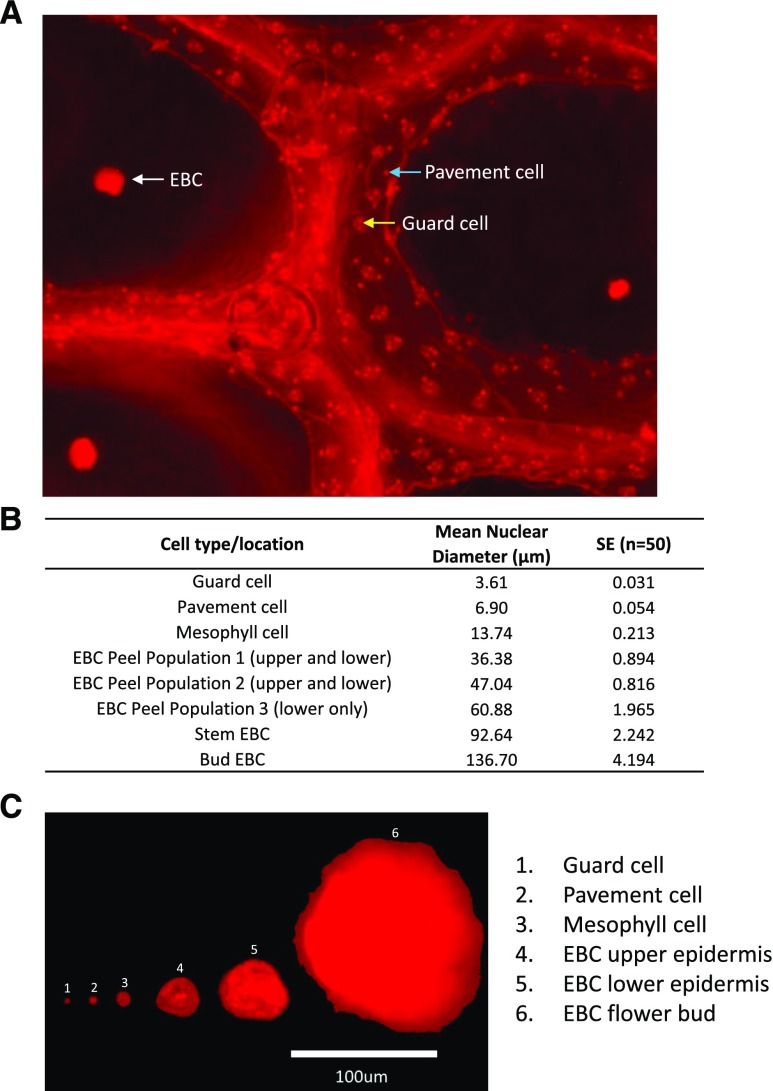
Figure 6.
Fluorescence microscopy of nuclei in different M. crystallinum cell types from salt-treated plants. A, Lower epidermal peels were stained in PI solution for 5 min in the dark, and a representative fluorescence microscopy image is shown. The white arrow indicates an EBC nucleus, the yellow arrow indicates the nucleus in a guard cell, and the blue arrow indicates a pavement cell nucleus. B, Table showing calculated nuclear diameters for selected cell types. Data are means ± se of 50 measurements per cell type. C, Composed figure showing the relative nuclear size of representative nuclei from different cell types.

