Figure 1.
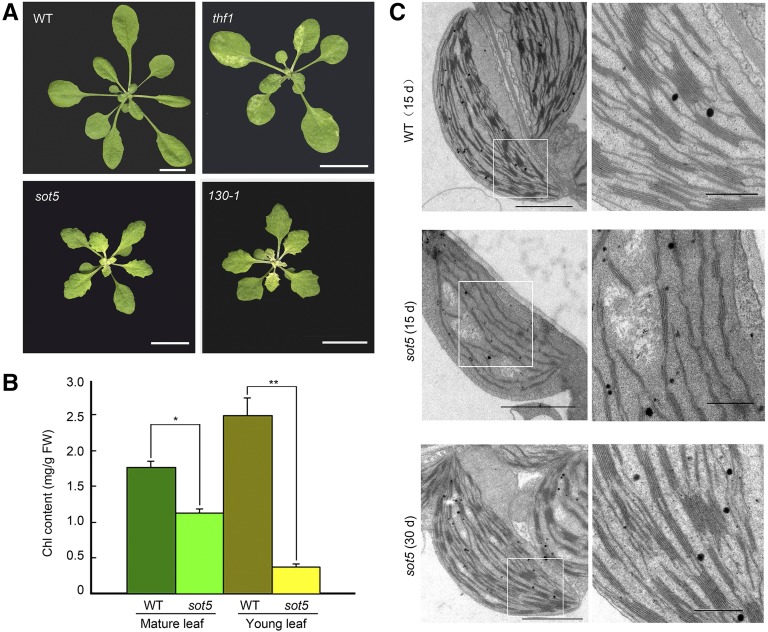
Identification and characterization of the sot5 mutant. A, Phenotypes of 30-d-old wild-type (WT), thf1, sot5, and 130-1 plants. Bars = 1 cm. B, Chlorophyll contents of mature and young leaves from 45-d-old wild-type and sot5 plants. The data represent means ± sd of three biological replicates. Asterisks indicate significant differences between the wild type and sot5 (Student’s t test, *, P < 0.05 and **, P < 0.01). FW, Fresh weight. C, Ultrastructure of chloroplasts in the first wild-type and sot5 true leaves sampled from 15- or 30-d-old plants. The images at right are closeups of the boxes in the left images. Bars = 2 μm at left and 0.5 μm at right.

