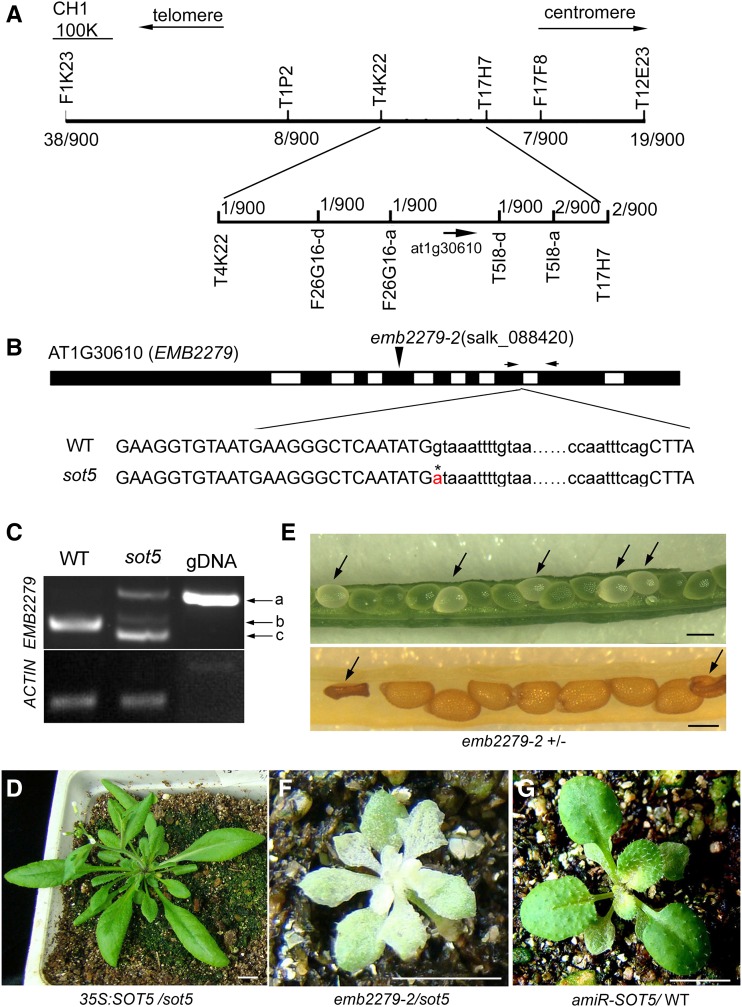
Figure 4.
SOT5 encodes EMB2279, a PPR protein. A, Map-based cloning of SOT5. SOT5 was mapped between two markers, F26G16-a and T5I8-d, on chromosome 1. The molecular markers used for fine-mapping are shown. Numbers indicate the recombinant sot5 mutants in 900 F2 individuals from crosses between sot5 (Col-0 ecotype) and Ler. B, Model for the SOT5 (AT1G30610) gene structure. The flanking sequences of the seventh intron are shown below the gene model. The G-to-A point mutation is labeled with an asterisk and red font in sot5 at the first position of the seventh intron. The position of the T-DNA insertion in emb2279-2 (SALK_088420) is shown above the gene model. The arrows show the primers used for RT-PCR. WT, Wild type. C, RT-PCR analysis of SOT5 transcripts in Col-0 and sot5 by using the primer pair shown in B. There are three bands, designated a, b, and c, in sot5. Genomic DNA (gDNA) was used as a temperate control, while the expression of ACTIN was used as a positive control. D, Overexpression of SOT5 cDNA complemented the phenotype of sot5. Bar = 1 cm. E, The null mutation emb2279-2 is embryo lethal. The top image shows the albino seeds (arrows) in a young emb2279-2 heterozygote silique. The bottom image shows the aborted seeds (arrows) in an older emb2279-2 heterozygote silique. Bars = 1 mm. F, Allelic test of sot5 and emb2279-2. The F1 plant of sot5/emb2279-2 appears albino and is seedling lethal. Bar = 1 cm. G, Knockdown lines of SOT5 by the artificial microRNA technique exhibit a leaf virescent phenotype. Bar = 1 cm.

