Figure 5.
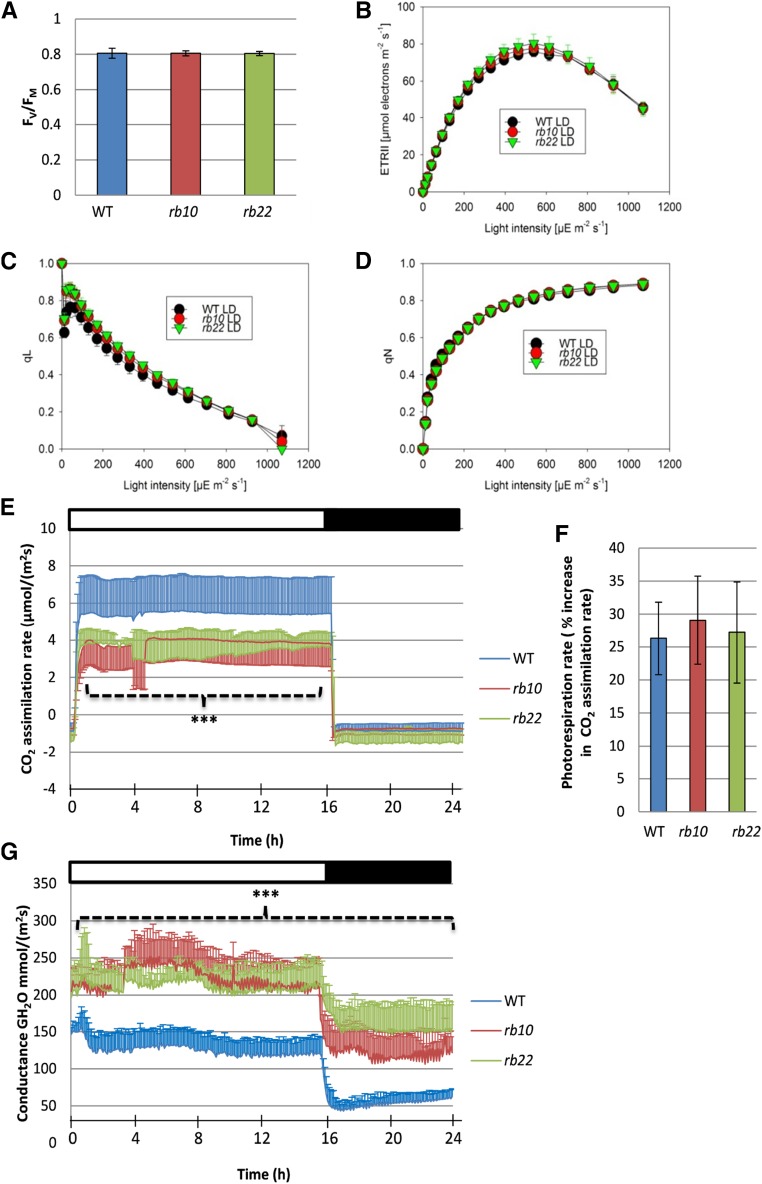
Photosynthetic efficiency and gas-exchange measurements of the wild type (WT) and raptor1b. A, Fv/Fm of wild-type and raptor1b leaves. B to D, Light-response curves of linear ETR (B), qL (C), and qN (D) of the wild type and raptor1b. E, Net CO2 assimilation rate of raptor1b compared with the wild type. F, Assimilation rate under nonphotorespiratory conditions of the wild type and raptor1b. G, Stomatal conductance of raptor1b compared with the wild type. Measurements were performed on rosette leaves from soil-grown plants at the same developmental stage under LD conditions. Plants were dark adapted for 30 min before the commencement of chlorophyll fluorescence imaging at the beginning of the day, 1 h after illumination. Data represent means ± sd for five biological replicates. Asterisks indicate significant differences from the wild type under the same condition (***, P < 0.001, Student’s t test). White and black bars on the top of the graphs in E and G indicate light and dark periods, respectively.

