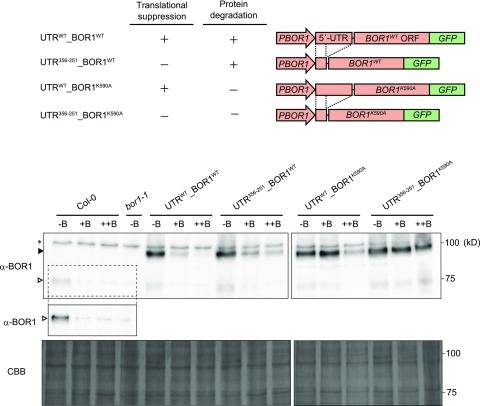
Figure 6.
BOR1-GFP accumulation under different boric acid concentrations in transgenic plants with various disruptions in BOR1 regulation mechanisms. The top shows schematic representations of DNA constructs. The presence and absence of posttranscriptional regulations are indicated with + and −, respectively. GFP was fused to the C terminus of BOR1WT/BOR1K590A. The DNA constructs were introduced into bor1-1, a BOR1 loss-of-function mutant. The bottom shows immunoblot analysis of the microsome fraction from plant roots. Plants were grown for 12 d on solid medium containing 0.3 μm (−B), 100 μm (+B), and 1,000 μm (++B) boric acid. A representative accumulation pattern is shown. White and black arrowheads indicate the positions of protein bands corresponding to native BOR1 and BOR1-GFP, respectively. The asterisk indicates nonspecific bands. The protein bands that resemble that of native BOR1 in the bor1-1 transformed lines could be degradation products of BOR1-GFP. Images of two different membranes are shown. For Columbia-0 (Col-0) and bor1-1, the protein bands corresponding to native BOR1 (dashed box) are shown in higher contrast in the cropped image. Membrane staining with Coomassie Brilliant Blue (CBB) is depicted below as a loading control.

