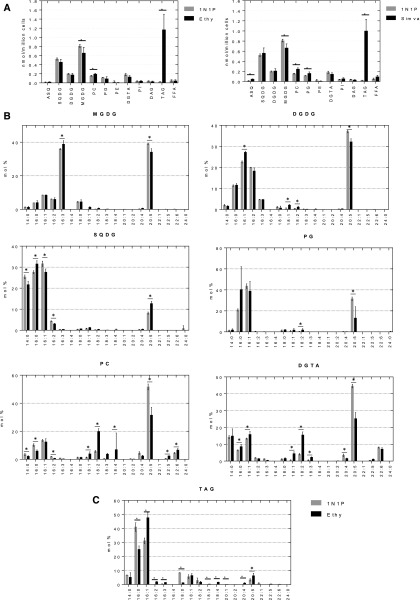
Figure 6.
Glycerolipid profile following treatment with ethynylestradiol. P. tricornutum cells were cultivated in 1N1P medium until a cell density of 1 × 10⁶ cells mL−1 was reached. Cells were then incubated for 48 h in the presence or absence of compounds, as indicated. Lipids were extracted, separated by thin-layer chromatography (TLC), and analyzed as described in “Materials and Methods.” A, Glycerolipid profiles following treatments with 30 µm ethynylestradiol and simvastatin. Glycerolipids are expressed in nmol per million cells. B, Fatty acid profiles of membrane glycerolipids following treatment with 30 µm ethynylestradiol. C, Fatty acid profile of TAG following treatment with 30 µm ethynylestradiol. Data correspond to biological triplicates ± sd. ASQ, Acylsulfoquinovosyldiacylglycerol; DAG, diacylglycerol; Ethy, ethynylestradiol; FFA, free fatty acid; PE, phosphatidylethanolamine; PI, phosphatidylinositol; Simva, simvastatin. *, P < 0.05 (Student’s t test). Error bars indicate sd.

