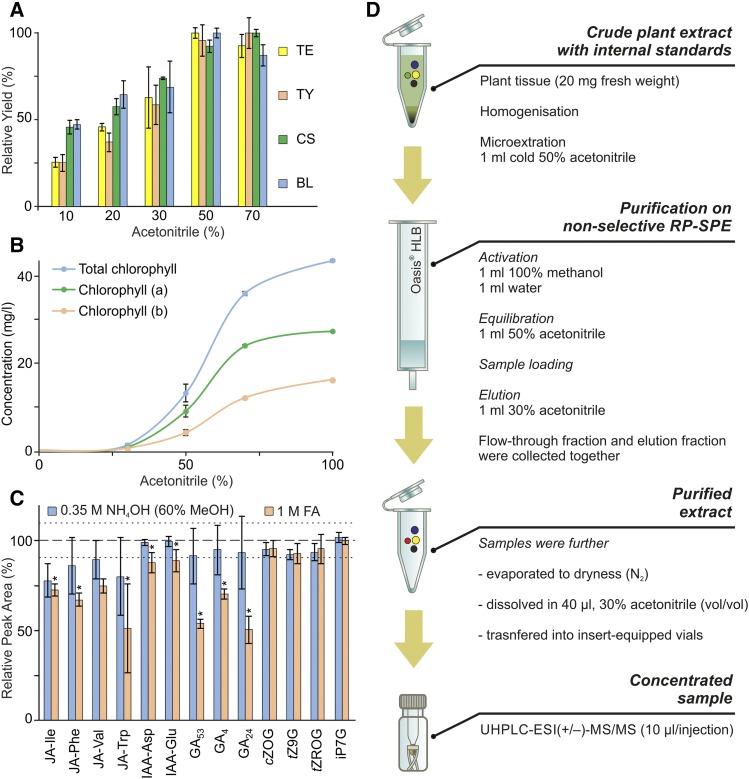
Figure 1.
Optimization of sample preparation. A, Solubility of selected BRs (TE, teasterone; TY, typhasterol; CS, castasterone; BL, brassinolide), the most hydrophobic phytohormone class included in our study, in extraction solvents with varied ACN contents. Relative yield (ratio, in percentage, of average peak area to maximal average peak area per extraction solvent) is shown (error bars represent sd; Supplemental Table S10). B, Amounts of chlorophyll extracted (mg L−1) using extraction solvents with the indicated ACN concentrations (error bars represent sd; Supplemental Table S11). C, pH-dependent stability (relative peak area, in percentage) of selected compounds (JA-Ile, jasmonoyl-l-Ile; JA-Phe, jasmonoyl-l-Phe; JA-Val, jasmonoyl-l-Val; JA-Trp, jasmonoyl-l-Trp; IAA-Asp, indole-3-acetyl-l-Asp; IAA-Glu, indole-3-acetyl-l-Glu; cZOG, cis-zeatin-O-glucoside; tZ9G, trans-zeatin-9-glucoside; tZROG, trans-zeatin riboside-O-glucoside; iP7G, N6-isopentenyladenine-7-glucoside) dissolved in 0.35 m NH4OH in 60% methanol (MeOH) and 1 m formic acid (FA), based on peak areas relative to peak areas of compounds dissolved in control solvent (50% ACN). The dashed line represents the average peak area, and the dotted lines represent the average of sd values for compounds dissolved in the control solvent; asterisks indicate significant changes compared with the control: *, P < 0.05, by Student’s t test (Supplemental Table S12). D, Scheme of sample microextraction and purification prior to UHPLC-ESI-MS/MS analysis. RP, Reverse phase.

