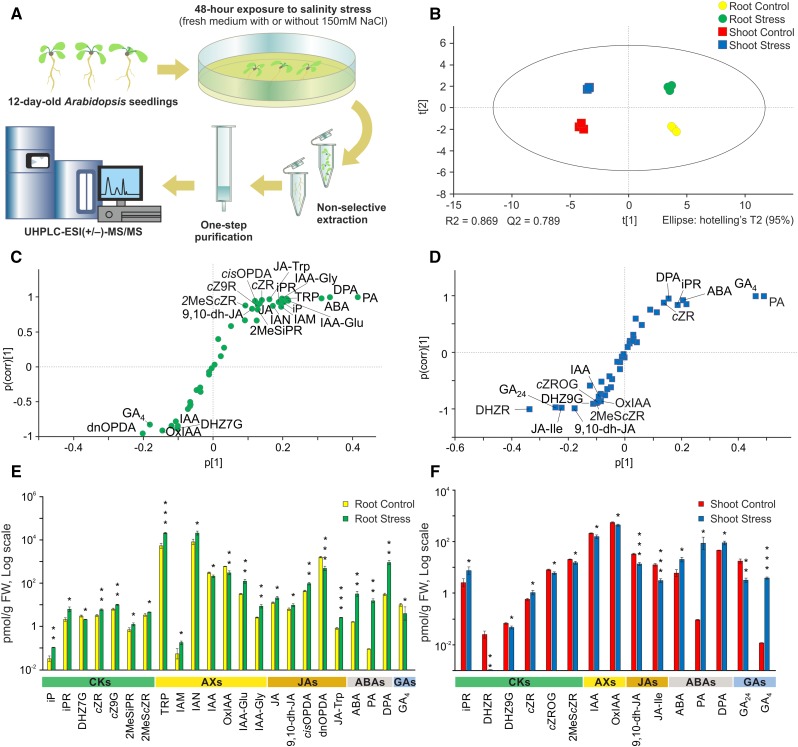
Figure 4.
Comparison of phytohormones in Arabidopsis roots and shoots exposed to salinity stress and controls. A, Schematic illustration of the salinity stress experiment. B, Principal component analysis (PCA) score plot showing the separation and grouping of samples (roots and shoots of control and salt-stressed plants) according to the composition and abundance of determined compounds. C and D, Orthogonal projections to latent structures discriminant analysis (OPLS-DA) S-plots showing the variables responsible for separating roots of control and salt-stressed plants (C) and their shoots (D), combining covariance (p[1], the farther the distance from zero, the higher the contribution to the difference between two groups) and correlation (p(corr)[1], the farther the distance from zero, the higher the reliability). E and F, Levels of targeted compounds in roots (E) and shoots (F) in pmol g−1 fresh weight (FW), logarithmic scale. Asterisks indicate significant differences between salt-stressed and control plants: *, P < 0.05; **, P < 0.01; and ***, P < 0.001, by Student’s t test; error bars represent sd. Compound abbreviations are listed in Supplemental Table S1.

