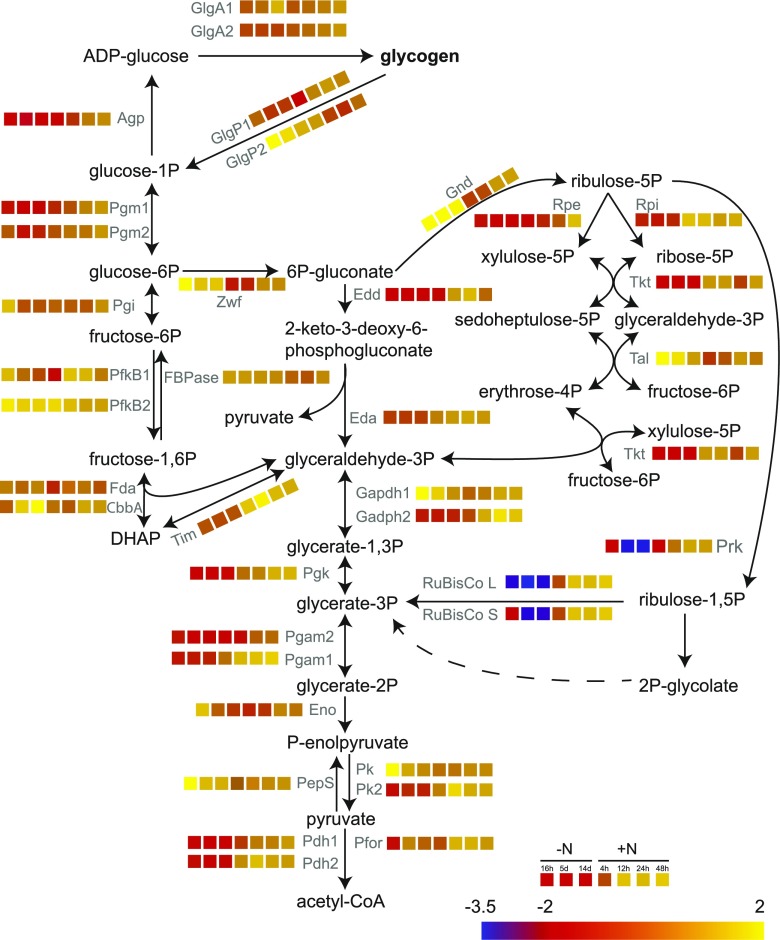
Figure 7.
Transcriptional regulation of genes needed for glycogen catabolism during nitrogen starvation (16 h, 5 d, and 14 d) and resuscitation (4, 12, 24, and 48 h). Analysis was performed using a high-resolution microarray (Agilent; format, 8 × 60 K; slide layout = IS-62976-8-V2) as described by Klotz et al. (2016). Relative transcript abundance normalized to exponential growth is shown as log2 and encoded in a color code from blue (2−3.5) to yellow (22).

