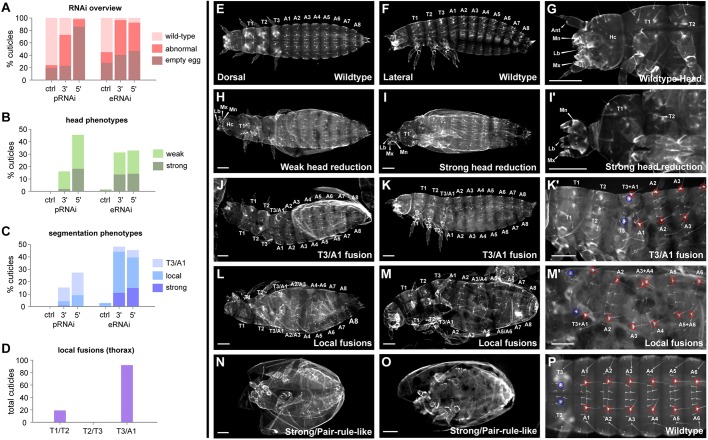
Fig. 7.
Tc-opa RNAi reveals head and segmentation roles. (A) Summary results for pRNAi and eRNAi, compared with sham-injected controls. (B,C) Quantification of head and segmentation phenotypes following RNAi. (pRNAi data are from a different experiment from that shown in A, see Table S1.) (D) Counts of RNAi-induced local segment fusions within the thorax (all experiments). (E-G,P) Wild-type larval cuticles. (H-I′) Representative larval cuticles with RNAi-induced head phenotypes. (J-O) Representative larval cuticles with RNAi-induced segmentation phenotypes. Blue (thoracic) and red (abdominal) circles in K′,M′,P highlight the relative position of homologous bristles. Scale bars: 100 µm. See Tables S1-S3 and Figs S11, S12 and S14 for more details.

