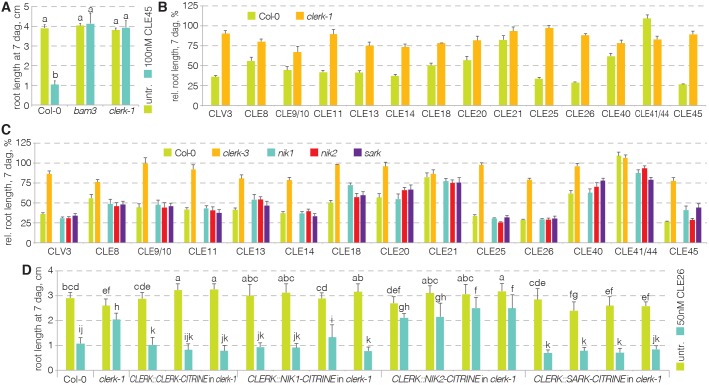
Fig. 2.
Resistance of clerk mutants to a range of root-active CLE peptides. (A) Response of clerk mutants to CLE45 when compared with Col-0 and bam3 (ANOVA, P<0.001; n=16-19). Statistically significant differences are indicated by letters (Tukey test, alpha=0.05). (B) Response of clerk mutants to a range of root-active CLE peptides when compared with Col-0 (ANOVA, P<0.001; n=13-25). (C) Response of indicated mutants to a range of root-active CLE peptides and controls (ANOVA, P<0.001; n=4-25). Please see Table S1 for statistically significant differences (Tukey test, alpha=0.05). (D) Response of indicated genotypes (several independent transgenic lines per construct) to CLE26 treatment and controls (ANOVA, P<0.001; n=21-43). Statistically significant differences are indicated by letters (Tukey test, alpha=0.05). See Table S1 for full Tukey test results and ANOVA tables. Error bars represent s.e.m.

