Figure 4.
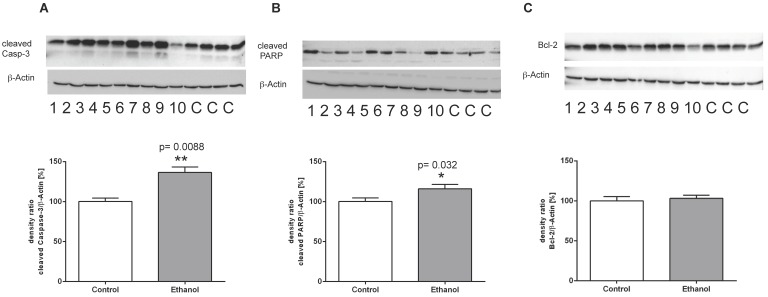
Protein expression of (A) (cleaved) Caspase-3, (B) (cleaved) PARP-1 and (C) Bcl-2 in livers of rats after 12 weeks of chronic alcohol consumption (ethanol; lanes 1-10) or controls (lanes C, for more clarity, protein lysates of controls have been pooled). Detection of β-actin served as loading control. This example is representative of a series of blots. Quantification of bands is expressed as density ratio of indicated protein/β-actin (%); control set to 100%; *p<0.05, **p<0.01 compared with controls; data are presented as mean ± SEM (n=10).

