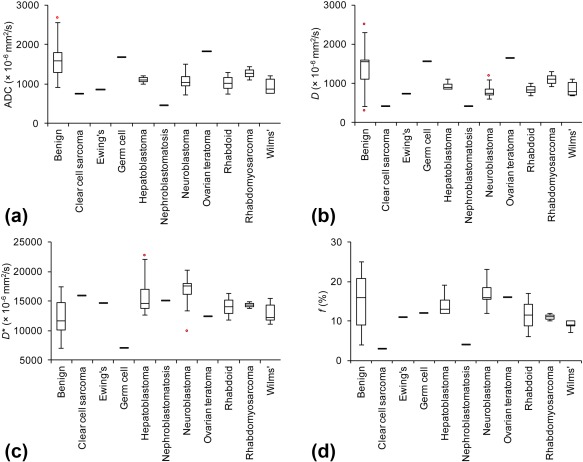
Figure 2.

Boxplot distributions of median ADC and IVIM parameters for different tumor types. Plots shown for (a) ADC, (b) D, (c) D*, and (d) f parameter. Top and bottom of boxes represent 25% and 75% percentiles of data values, respectively, and the horizontal lines in boxes represent the median. The whiskers extend to the most extreme data points not considered outliers and outliers are indicated by red circles.
