Figure 3.

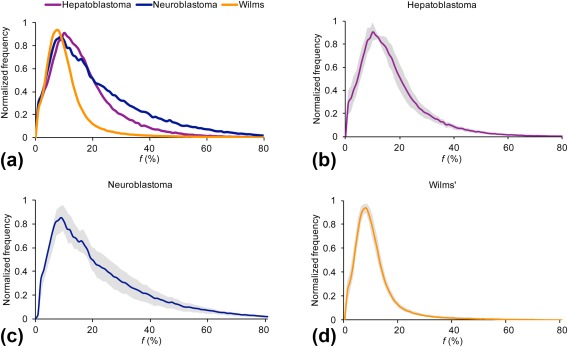
Average perfusion fraction, f, histograms. Histograms shown for (a) hepatoblastoma (n = 4), neuroblastoma (n = 11), and Wilms' tumor (n = 8). The (b–d) histograms indicate the SD (shown in gray) between cases in each major tumor group.

Average perfusion fraction, f, histograms. Histograms shown for (a) hepatoblastoma (n = 4), neuroblastoma (n = 11), and Wilms' tumor (n = 8). The (b–d) histograms indicate the SD (shown in gray) between cases in each major tumor group.