
Figure 5.
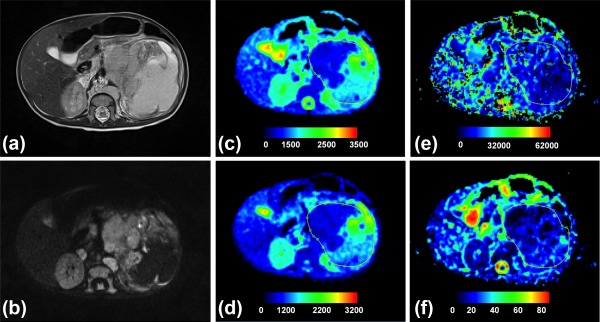
Histologically verified neuroblastoma (grade IV). (a) T2‐weighted and (b) b = 150 images, and (c–f) parametric maps (ADC, D, D*, and f, respectively). Whole tumor ROI is shown drawn on the parametric maps. The calculated median values of ADC, D, D*, and f for the drawn ROI were 1155 × 10−6 mm2/s, 703 × 10−6 mm2/s, 17,762 × 10−6 mm2/s, and 23%, respectively.