
Figure 6.
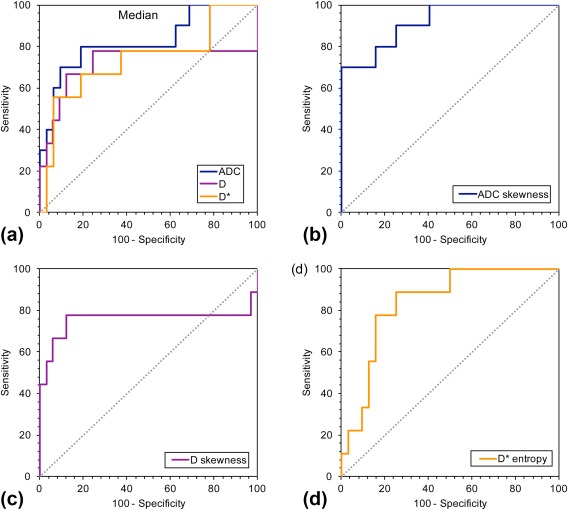
ROC curves for diffusion parameters to compare the performance in discriminating benign from malignant tumors. ROC curves for median (a) ADC, D, and D*, and the ROC curves with the highest AUC values for each parameter: (b) ADC skewness, (c) D skewness, and (d) D* entropy.