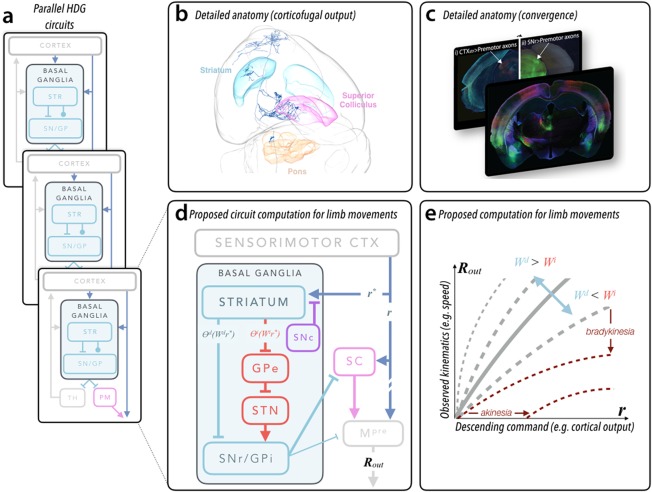
Figure 1.

Proposed functional architecture of basal ganglia. (a) Schematic of basal ganglia organization highlighting the parallel organization of both reentrant loop architecture (as in eference101 and the feed‐forward, convergent pathways discussed in this article. Whereas the reentrant loop circuits flow through the ascending basal ganglia output to thalamus (TH), the feed‐forward, convergent pathways flow through specific premotor (PM) structures in the midbrain and brain stem (more akin to the feed‐forward pathways in lower vertebrates102. (b) Detailed anatomical evidence for convergence of feed‐forward pathways. A rendering of a single corticofugal neuron in the anterior sensorimotor cortex and its axonal arborization through the entire mouse brain reconstructed using the method in reference36 and rendered with software developed by the MouseLight project (https://www.janelia.org/project-team/mouselight). Important brain regions discussed in the text are indicated. Striatum is cyan, deep layers of superior colliculus are pink, and the basal pontine nuclei are orange. (c) Fluorescent images in (i) and the front panel obtained from injection of a retrograde virus expressing fluorescent proteins in the dorsal striatum reveal cortical inputs and clearly illuminate the corticofugal pathway (intermingled axon bundles below thalamus). Modified from reference 29. Corticofugal axons can be followed in to the superior colliculus in a more posterior section (i). Comparison with tissue in which the substantia nigra pars reticulata was infected with an anterograde virus (ii) reveals convergent termination zones (indicated by arrows; image modified from data in reference 63). (d) Schematic diagram of cortical‐BG circuitry described in the text and focusing on the convergent pathways relevant to movements of the forelimb in mice (similar to recent proposals19. Labels on individual pathways represent terms in computation depicted in (e) and in the main text. r and r* describe the cortical output (eg, vector of firing rates) providing excitatory input to subcortical premotor structures (broadly defined) and striatum, respectively. As mentioned in the text, r and r* are correlated but not identical. The output of the direct and indirect pathway striatal projection neurons are expressed as an input‐output function (θi/d) of the cortical input (r*) multiplied by the synaptic strengths of corticostriatal inputs (Wi/d). The net output (Rout) — a motor command — reflects integration of basal ganglia output and direct cortical output (see main text for details). (e) Here we plot the predicted change in observed movement kinematics — a consequence of R out — as a function of the cortical output, r. The shape of the curve is drawn for different ratios of average strength of the direct (Wd) and indirect (Wi) corticostriatal synaptic strengths. When this becomes dramatically altered (ie, following dopamine depletion), the slope of the curves is dramatically reduced (dark red, dashed lines). We also annotate the specific changes in this computation that map to the clinically observed symptoms of bradykinesia (reduction in average speed) and akinesia (a paucity of movement; assuming Rout ≤ 0 results in an absence of movement). We note that the shape of the curves depends on nonlinearities in input‐output functions θ; for simplicity, here we assume the same nonlinearity modifies r* and r. Example simulations of models implementing this function can be found in references 56 and 63.
