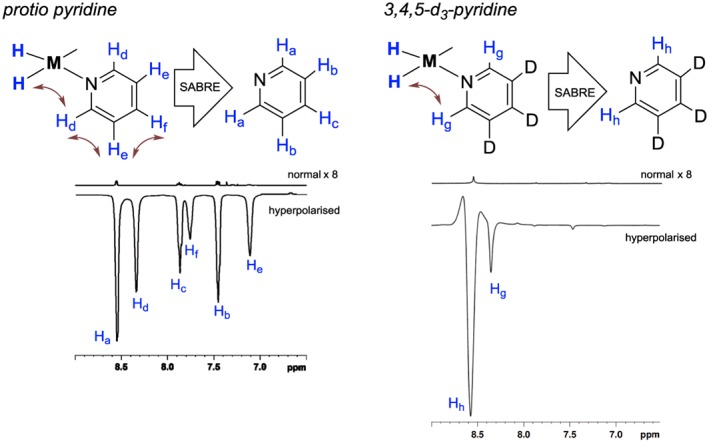
Figure 2.

Left: two single scan 1H NMR spectra that illustrate pyridine (3) signals (attributed according to inset scheme) that result after SABRE (hyperpolarised) and when the polarization level matches that for thermodynamic equilibrium (normal). Right: two similar single scan 1H NMR spectra employing 3a. The normal traces are shown with a ×8 vertical expansion relative to the hyperpolarized trace
