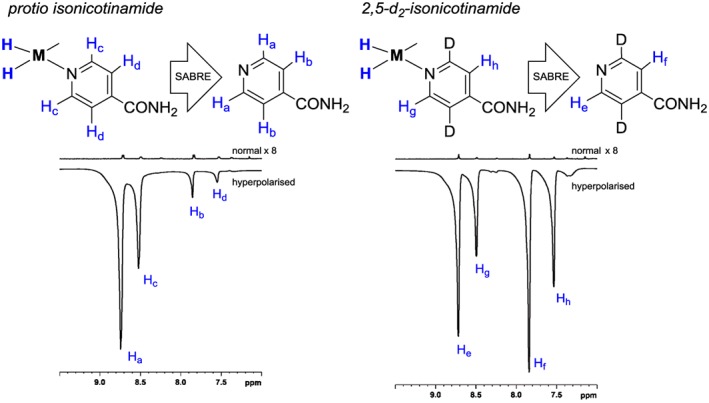
Figure 5.

Left: single scan 1H NMR spectra for hyperpolarized and fully relaxed isonicotinamide 5 at 400 MHz. Right: corresponding single scan 1H NMR spectra of 5b. The normal traces are shown with a ×8 vertical expansion relative to the hyperpolarized traces
