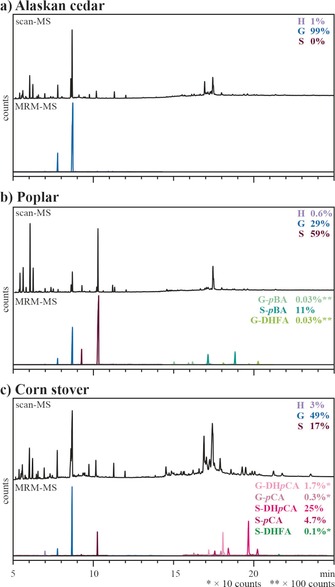
Figure 3.

Comparison of chromatograms obtained under scan (100–600 m/z) and MRM acquisition mode for a) Alaskan cedar, b) poplar, and c) corn stover. In each case, the Figure displays the total ion chromatograms from the MS scan appears above the MRM traces of the transitions used for quantitation. The MRM traces were scaled according to their relative abundance as indicated on the right side of the chromatograms. Quantitative data can be found in Table 1.
