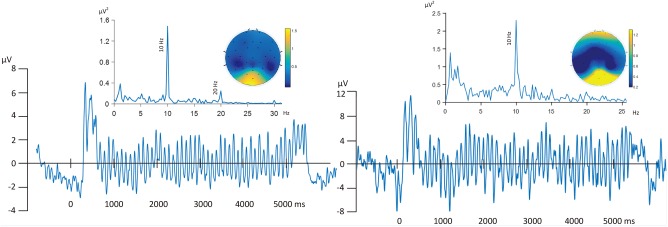
Figure 4.

Left panel: Grand Mean ssVEP time series, frequency spectrum, and amplitude topography, averaged across all trials and 11 participants. Right panel: ssVEP time series, frequency spectrum, and amplitude topography shown for a representative single participant. [Color figure can be viewed at http://wileyonlinelibrary.com]
