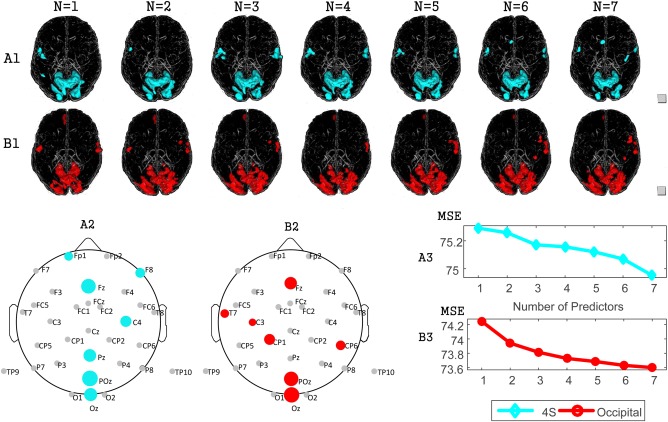
Figure 5.

Correlation maps as a function of the number of EEG predictors. N indicates the number of predictors. (A) Analysis with a standard 4s lag, (B) analysis when determining the time lag parameter based on an ROI in occipital cortex. (A1, B1): Glass views from left to right show the co‐varying areas with 1‐7 predictors. (A2, B2): The locations of electrodes selected with standard (A2) and occipital ROI‐based lags (B2). The size of the electrodes reflects the order of selection. (A3, B3): Mean square error (MSE) of the EEG‐BOLD prediction with increasing numbers of predictors, determined for a standard lag (A3) and the ROI‐based lag (B3). [Color figure can be viewed at http://wileyonlinelibrary.com]
