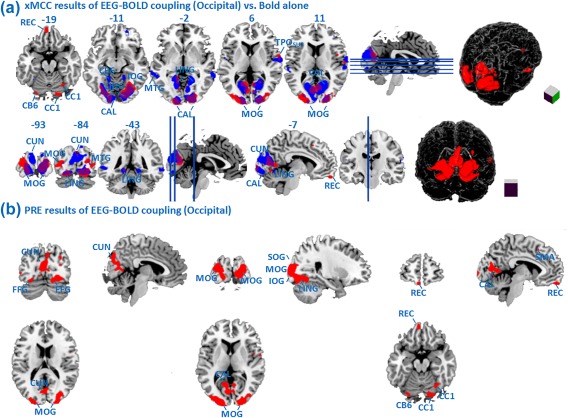
Figure 7.

(A) Maps of EEG‐BOLD correlation (xMCC) with selected predictors (Oz, POz, Fz, CP1, red), with time lag determined for the occipital ROI, in contrast to fMRI‐alone analysis (blue); (B) Maps of the EEG‐BOLD PRE measure with the same predictors (Oz, POz, Fz, CP1, red), and lag determined for the occipital ROI. All maps are thresholded at P < 0.01. [Color figure can be viewed at http://wileyonlinelibrary.com]
