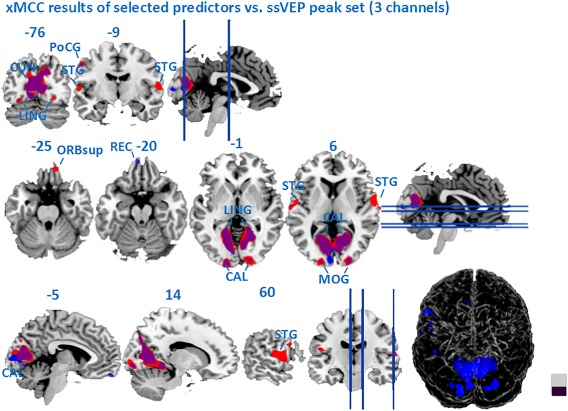
Figure 9.

Map of xMCC‐based EEG‐BOLD coupling (computed with the standard 4‐second lag and the optimum predictors), in contrast to the correlation map based on an a‐priori ssVEP peak of three occipital sensors (Oz, O1, O2, blue). [Color figure can be viewed at http://wileyonlinelibrary.com]
