
Figure 10.
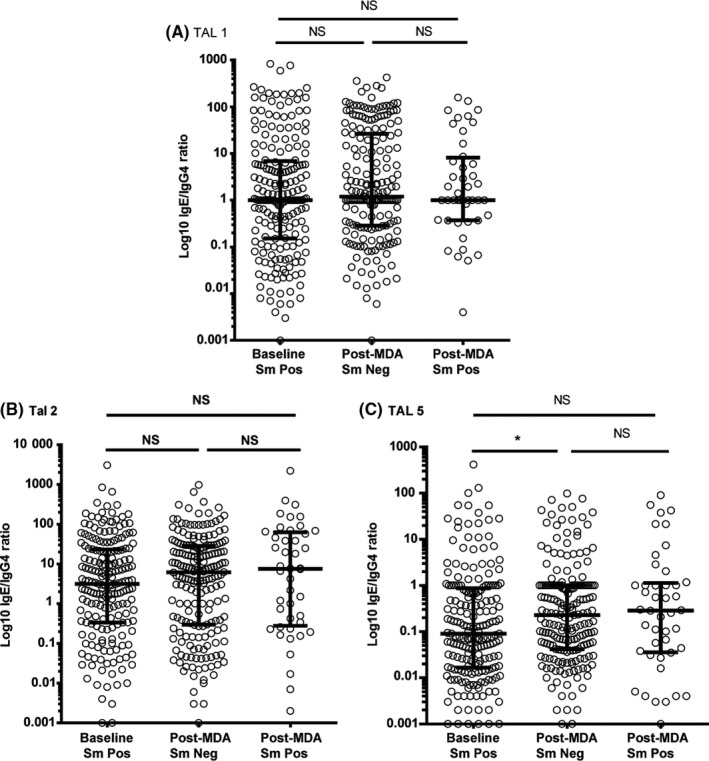
Anti‐TAL‐1 (A), anti‐TAL‐2 (B) and anti‐TAL‐5 (C) IgE/IgG4 ratios levels at baseline for children who were all Schistosoma mansoni egg‐positive, and after 4 mass drug administrations (MDAs) (post‐MDA group) in children who were egg‐negative and those who were egg‐positive. Data are presented as dot plots, medians at centreline and whiskers at 25th and 75th percentile. Comparison was done by Kruskal‐Wallis followed by Dunn's multiple comparison test. *P < .05