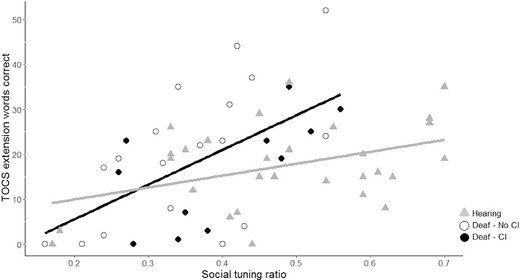
Figure 2.

The number of words correctly identified in the Test of Child Speechreading everyday questions task plotted against social‐tuning ratio for both deaf and hearing participants. The relationship between these variables was significant for both groups. The slope for the deaf group (dark red) was steeper than that for the hearing group (black). To illustrate additional aspects of the heterogeneity of the deaf group, deaf children with a cochlear implant (CI) are coded in yellow (n = 11) and deaf children without CI are coded in red (n = 18). Performance of deaf children with and without CIs are not contrasted statistically due to small sample sizes.
