
Figure 1.
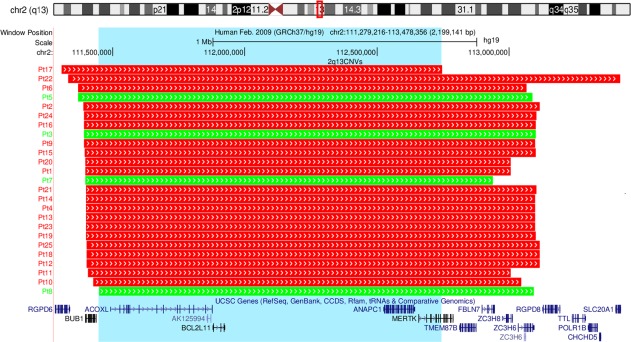
Chromosomal location of the CNV breakpoints for 2q13 CNV carriers (n = 25). The top of the image shows the location of the CNV region (highlighted by a red box) on a schematic of chromosome 2. The chromosomal breakpoints for each participant are shown by the red (representing CNV deletions) and green (representing CNV duplications) boxes. UCSC genes contained in the 2q13 region are shown. The blue highlighted box displays the 1.3 Mb region of overlap between CNVs. The image was exported from UCSC in chromosomal build GRCh37/hg19 [Color figure can be viewed at http://wileyonlinelibrary.com]