
Figure 1.
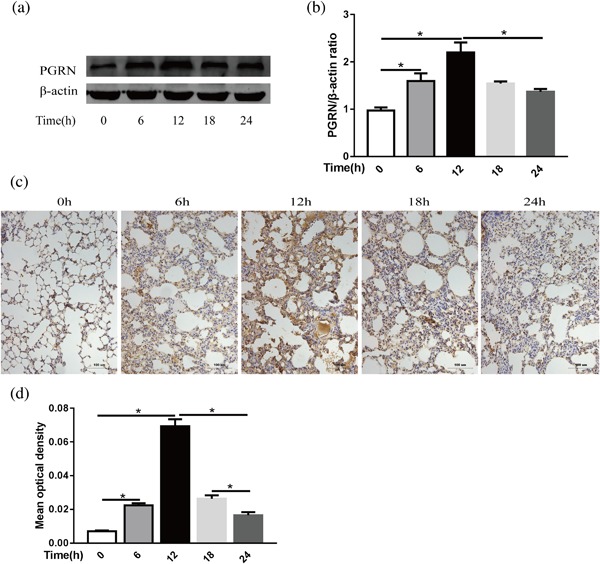
PGRN expression in whole lungs at different times after LPS injection in mice. (a) PGRN protein levels in mouse lungs at different times after administration of LPS (1 mg/kg) were evaluated by Western blot, and β‐actin was used as a loading control. (b) Quantitation of the PGRN/β‐actin ratio in the lungs from mice with LPS injections at different times. (c) Representative images of PGRN expression in lung sections after administration of LPS per immunohistochemical staining. Scale bar = 100 μm, n = 4 (d) Quantitation of the mean optical density of PGRN in the lung from mice with LPS injection at different times. *p < 0.05. Data are presented as the mean ± SD