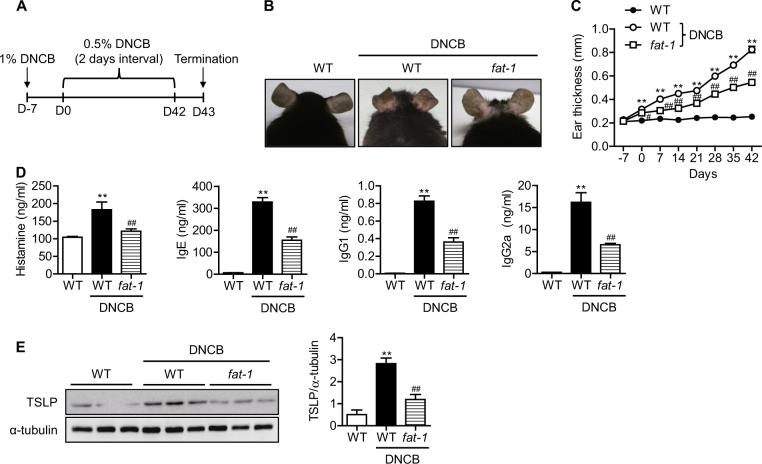
Fig. 1. DNCB-induced atopic dermatitis-like symptoms in mice.
a A schematic diagram showing the induction of atopic dermatitis-like skin lesions by DNCB treatment in mice. b Representative pictures of mouse ears on Day 42. c Ear thickness was measured weekly from day 7 to 42 (n = 4). d Serum histamine, IgE, IgG1, and IgG2a in mice were measured by ELISA (n = 7–9). e TSLP in ear skin was measured by western blotting with densitometry (n = 3). Values are means ± SEMs. **p < 0.01 vs. WT; #p < 0.05 and ##p < 0.01 vs. WT+DNCB

