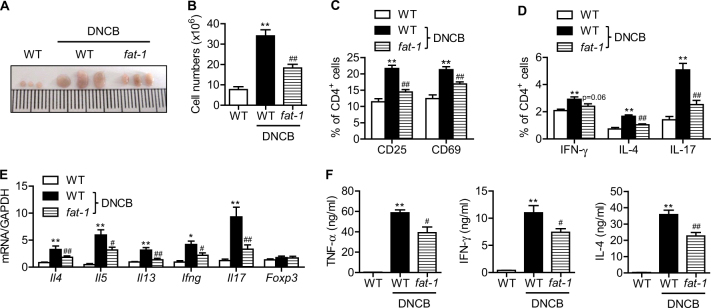
Fig. 3. T cell activation and differentiation in the draining lymph nodes.
a At the end of the study, submandibular lymph nodes were collected, and photographs were taken. b Single-cell suspensions were prepared from dLNs, and total cells were counted (n = 9). c CD4+ T cells were analyzed for CD25 and CD69 by flow cytometry (n = 9). d CD4+ T cells were stained for IL-4, IL-17, and IFN-γ and analyzed by flow cytometry. The percentage of CD4+ cells expressing each cytokine is shown (n = 9). e dLNs were homogenized, and the mRNA levels of cytokines were analyzed by real-time RT-PCR (n = 7). f Serum cytokines were measured by ELISA (n = 7). Values are means ± SEMs. **p < 0.01 vs. WT;#p < 0.05 and ##p < 0.01 vs. WT+DNCB

