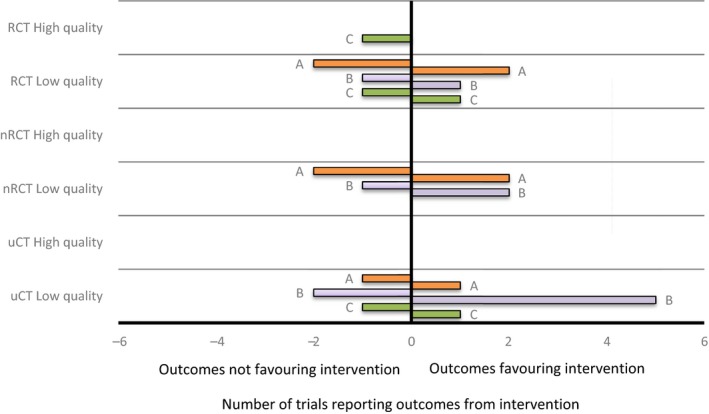
Figure 4.

Harvest plot displaying outcomes of trials of mobility interventions. (a) exercise (N = 5); (b) independent mobility (N = 8); (c) risk reduction (N = 3). Positive values are the numbers of trials reporting outcomes in favour of the intervention, negative values indicate trials reporting outcomes in favour of the control or reporting no between group or pre–postdifferences [Colour figure can be viewed at http://wileyonlinelibrary.com]
