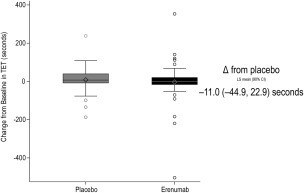
Figure 2.

Change from baseline in total exercise time (TET). Effect of erenumab on total exercise time (TET) during the post‐treatment exercise treadmill test (ETT). The box plot and whisker plot illustrate the median (line in middle of the box), mean (diamond), interquartile range (box), 1.5 interquartile range (whiskers), and outliers (open circles). CI, confidence interval.
