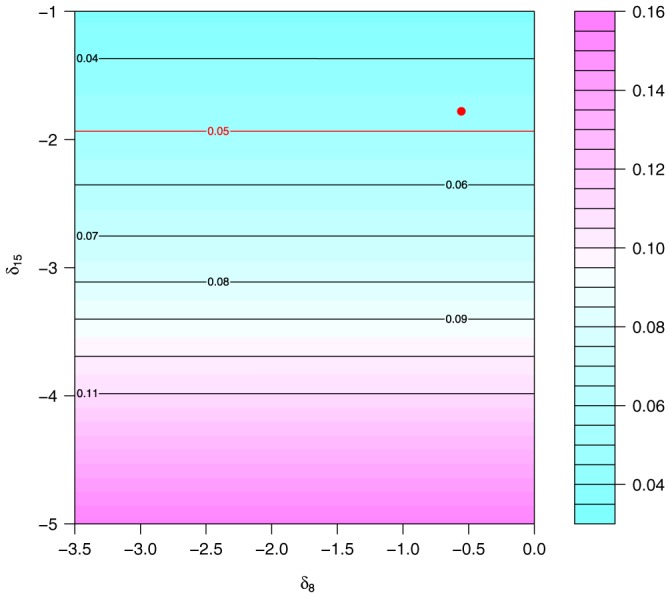
Figure 1.

Contour plot of significance tests (P value) for the pooled effect of gender on I Q 15. The red dot indicates the calibrated values of the conditional sensitivity parameters used in section 8.2, and the red contour (.05) indicates the point where values for δ 15 below the contour will yield an analysis with p<.05 [Colour figure can be viewed at http://wileyonlinelibrary.com]
