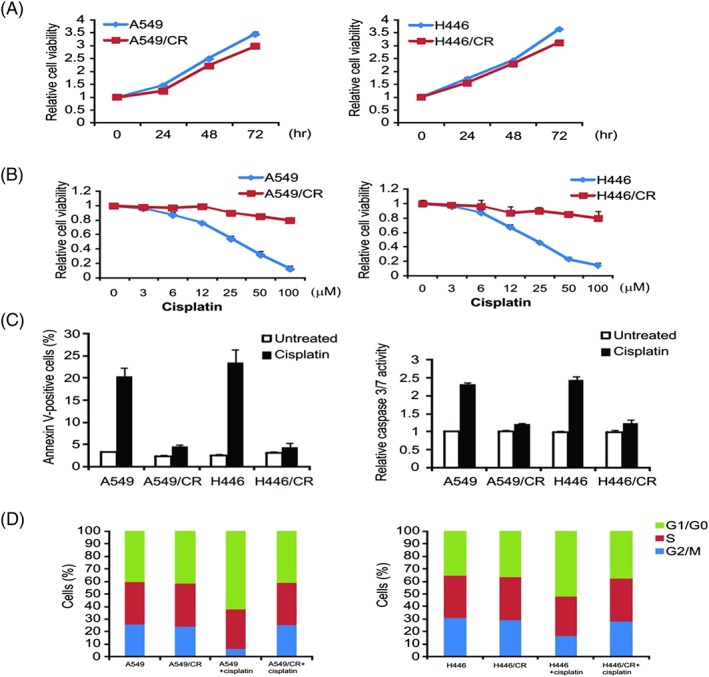
Figure 1.

Generation of cisplatin‐resistant A549 and H446 cells. (A) Cell proliferation curves of A549/CR and H446/CR and the parental cells determined by MTS assay. (B) The indicated cell lines were treated with increasing concentrations of cisplatin for 72 hours. Cell proliferation was determined by MTS assay. (C) The indicated cell lines were treated with 40‐μM cisplatin for 24 hours. Apoptosis was analysed by Annexin V/PI staining followed by flow cytometry (left). Caspase 3/7 activity was determined by fluorogenic analysis (right). (D) The indicated cell lines were treated with 20‐μM cisplatin for 24 hours. Cell cycle distribution was detected by flow cytometry. Results in (A), (B), and (C) were expressed as means ± SD of 3 independent experiments
