Figure 7.

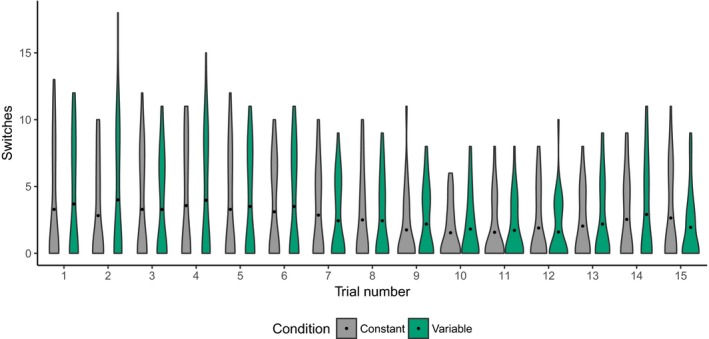
Switches between stimuli during referent selection. Bar width represents probability density. Black points represent mean switches.

Switches between stimuli during referent selection. Bar width represents probability density. Black points represent mean switches.