
Figure 2.
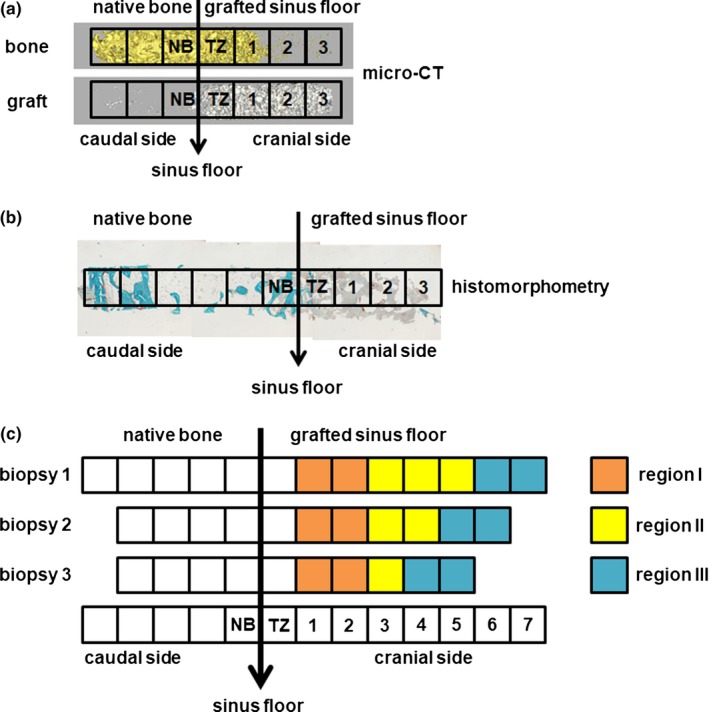
Methods of micro‐computed tomography and histomorphometrical analyses of bone biopsies. Bone biopsies are removed from the hollow burr and analyzed using (a) micro‐computed tomography and (b) histomorphometry. (c) Schematic diagram for micro‐computed tomography and histomorphometrical analyses. Biopsies were analyzed separately, starting from the caudal side of the biopsy and continuing toward the cranial side. Regions of interest (ROIs) of 1 mm2 were defined, and to obtain more insight into where the bone was formed within the grafted area, ROIs were numbered in a consecutive sequence starting from the sinus floor up to the most cranial part of the biopsy. The transition zone (tz) indicates the first ROI where substantial graft material (> 1% graft volume per total volume) was observed when analyzing the biopsy from the caudal to cranial side. Native bone (nb) is located before the tz (ROI 1). Depending on the length of the biopsy, we divided the ROIs after the tz in region I, region II, and region III. The number of ROIs in region I was 1 to 2; in region II, it ranged from 0 to 3, and in region III, it ranged from 0 to 2. For nb, tz, and each ROI, bone volume over total tissue volume (BV/TV) and graft volume over total tissue volume (GV/TV) were calculated and compared between the BCP60/40 group and BCP20/80 group