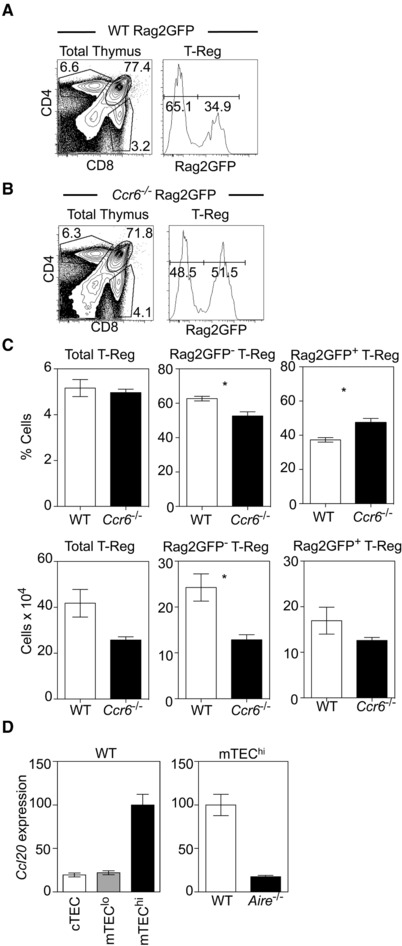
Figure 4.

Recirculating T‐Reg are reduced in the thymus of Ccr6 −/−Rag2GFP mice. Flow cytometry analysis of CD4, CD8 expression in WTRag2GFP (Panel A) and Ccr6−/−Rag2GFP (Panel B) thymocytes, together with Rag2GFP levels on CD25+Foxp3+ SP4 thymic T‐Reg. Panel (C) shows percentages (upper panels) and absolute numbers (lower panels) of Rag2GFP+ and Rag2GFP− thymic T‐Reg in WTRag2GFP (white bars) and Ccr6−/−Rag2GFP (black bars) mice. Error bars indicate SEM using an unpaired Student's two‐tailed t‐test: * p < 0.05. Data are pooled from at least three separate experiments, with at least 6 mice of each strain in total. Panel (D) shows qPCR analysis of Ccl20 mRNA levels in indicated TEC populations isolated from WT mice, and in mTEChi isolated from either WT or Aire−/− mice. Fold levels represent the mean +/‐SEM of replicate reactions. Data is representative of at least 2 independent experiments, where cDNA samples were prepared from sorted cells from at least 3 mice.
