
Figure 8.
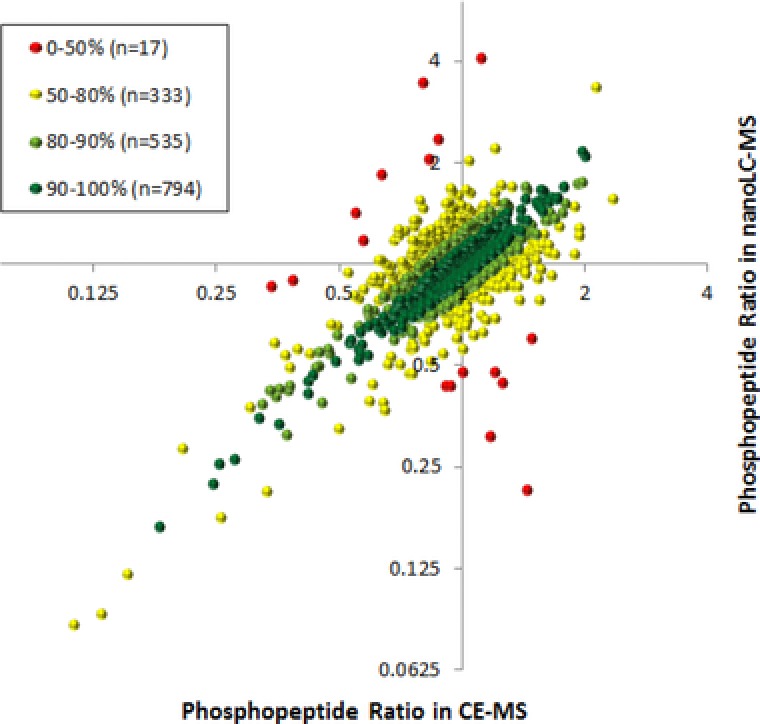
Reproducibility of phosphopeptide H/M ratios obtained by the two complementary approaches. Each dot represents a single phosphopeptide identified and quantified by both approaches. Illustrated dots were labeled according to the consistency of ratios obtained by the two complementary approaches given in the insert.