
Figure 6.
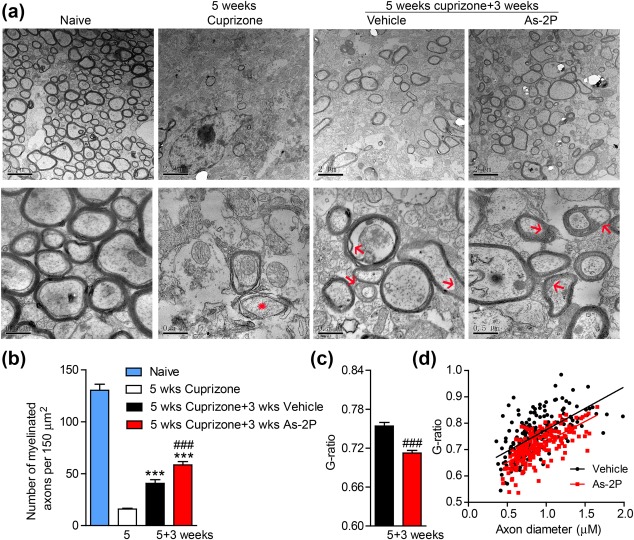
Evaluation of remyelination in cuprizone model with electron microscopy. (a) Representative electron microscopy images of the corpus callosum region isolated from cuprizone‐fed mice treated with As‐2P (200 mg kg−1) or vehicle for 3 weeks. Red asterisk indicates the demyelinating axon and the red arrows indicate the remyelinated axons. (b) Quantification of the myelinated axons from (a). Data are means ± SEM (three mice from each group, six sections from each mouse were analyzed). ***p < .001 versus cuprizone group, ### p < .001 versus vehicle group (one‐way ANOVA followed by Tukey's multiple comparison test). (c) Quantification of the G ratios of the remyelinated axons in (a). Data are means ± SEM (n = 200, ∼70 axons counted per mouse, three mice per group), ### p < .001 versus vehicle group (Student's t test). (d) The scatter plot displaying the individual G‐ratio values and axonal size distribution [Color figure can be viewed at http://wileyonlinelibrary.com]